CS684: Embedded System Course
Lab 1: Draw Statechart for Line following
Software used
- You can use online statechart editor for the implementation: Stately
- Resources:
Aim
- Draw a statechart for line following of a robot on a black line printed on a white surface.
- Objective is to move the robot from Start (S) to End (E) location. [Refer following diagram]
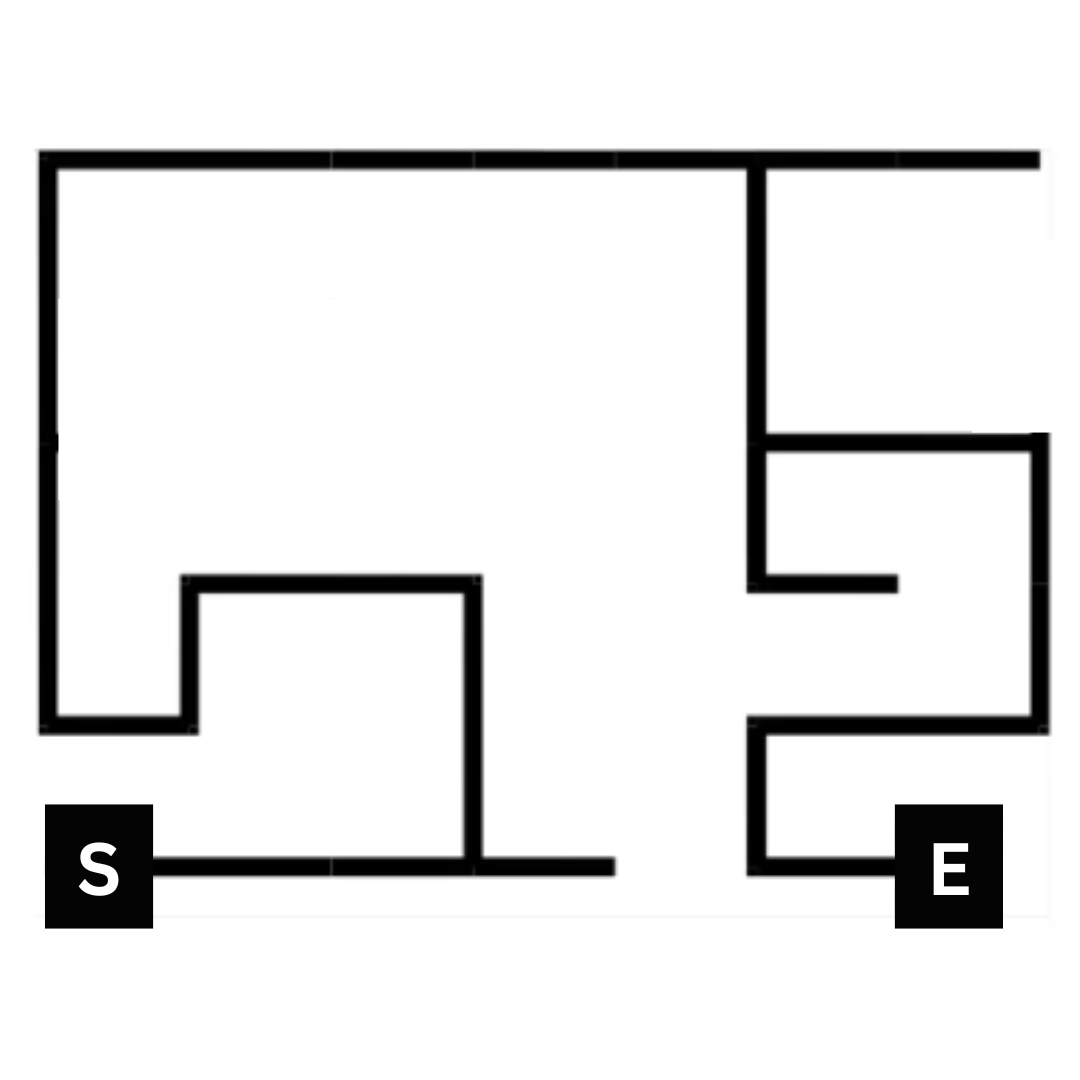
Note: The above image only gives an abstraction of some random path. It is just for reference. It will help you to build different states accurately.
Hint: According to given path, whenever robot encounters an intersection, it should take a respective turn which will lead the robot to End location.
- Inputs:
-
5 White Line Sensors
-
Each Sensor value ranges between: 0 to 1023
-
On white surface, sensor values are low and for black surface, sensor values are high
-
There can be N number of WLF Readings combinations that one can get.
-
- The following table shows few such cases:
| Position of robot | Images |
|---|---|
| All sensors on black line | 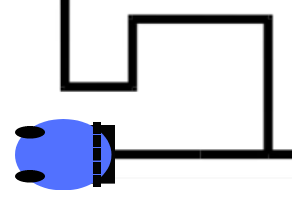 |
| Centre sensor on line | 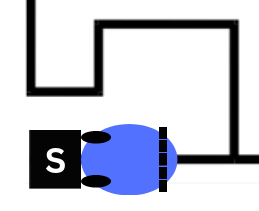 |
| Drifting towards left | 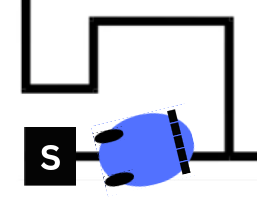 |
| Drifting towards right | 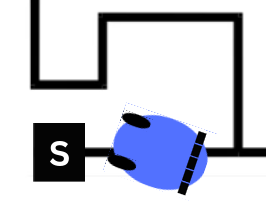 |
| At intersection | 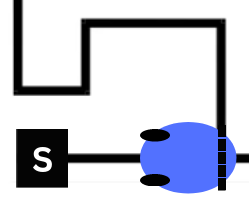 |
-
Outputs:
- 3 for controlling the motion of the Robot (1 for the direction and 2 for the velocities of the two motors)
- Direction output is binary: 0 means backward and 1 means forward
- Motor velocity ranges between 0 to 100
-
Using the above information, draw statechart for Line following of the robot
-
You are free to use any control algorithm for line following
You are free to make assumptions regarding readings of white line sensors at different instances, distance covered by robot for different motions in single step etc (mention the assumptions clearly in the document being submitted)
Submission Instructions
-
For Lab-1 submission, you have to upload a text file named
<group_name>.txtcontaining:- Link of the statechart (from Stately)
- Youtube link of the video - shoot the screen recording of the simulation of statechart in Stately for atleast 20 steps with different input combinations
- Information about the startergy used, assumptions made and description about the statechart; inputs used for simulation and outputs obtained in a tabular form
- Contribution of each team member
-
Upload the file on Moodle
-
Single submission must be done by each group. Member having highest roll no should do the submission.